Multiple Choice
The following distribution table represents preferences for two types of cereals by 2000 boys and girls. 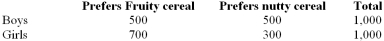 Find the probability that an individual selected at random will be a boy and prefer Fruity cereal.
Definitions:
Related Questions
Q1: When a household is randomly selected, the
Q14: Nominal data requires that the categories be_
Q29: If the enrolment for this Faculty of
Q48: Sampling error is the difference between a
Q52: The information below is the number of
Q62: A retailer claims that 90% of its
Q74: It has been estimated that 25% of
Q77: The probability that a loaf of bread
Q112: The standard normal probability distribution is one
Q124: A population consists of all the weights