Multiple Choice
Based on the graph below, how can we best describe the shape of this distribution? 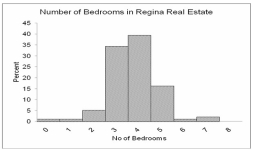
Definitions:
Related Questions
Q1: Three persons earn $8 an hour, six
Q14: The National Centre for Health Statistics reported
Q43: Refer to the following price of jeans
Q65: The arithmetic mean is_ .
Q78: The number of students at a local
Q79: Tabulation of a strike vote showed that
Q81: i. If we measure the weight of
Q90: In a binomial experiment, probability of_ or_
Q91: Affirmative action commitments by industrial organizations have
Q100: The annual incomes of the five vice