Examine the given run chart or control chart and determine whether the process is within statistical control. If it is not, identity which of the three out-of-statistical-control criteria
apply. A run chart for individual values W is shown below. Does there appear to be a pattern
suggesting that the process is not within statistical control? If so, describe the pattern. 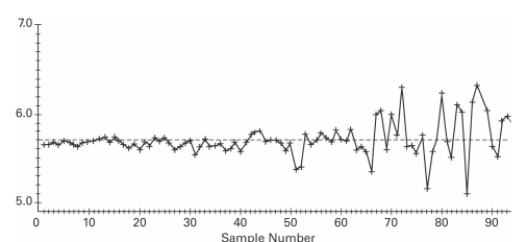
Definitions:
World's Population
The total number of people currently living on Earth.
World's Output
The total production of goods and services by all countries and economies worldwide over a specified period of time.
Poorest 20 Percent
The segment of the population with the lowest income, representing the bottom quintile in the distribution of income or wealth.
World Income
The total income generated by individuals and entities across the globe.
Q1: If z is a
Q3: A researcher wishes to determine whether the
Q11: The price of a desk was 5y.
Q20: Use the given information to find
Q29: When testing the claim that
Q32: <img src="https://d2lvgg3v3hfg70.cloudfront.net/TB6914/.jpg" alt=" A)not a function
Q36: <span class="ql-formula" data-value="f ( x ) =
Q44: Responses to a survey question about
Q70: Mary is investing <span class="ql-formula"
Q168: Find the perimeter of a triangle