Essay
A control chart for is shown below. Determine whether the process mean is within statistical control. If it is not, identify which of the three out-of-control criteria lead to rejection of a statistically stable mean.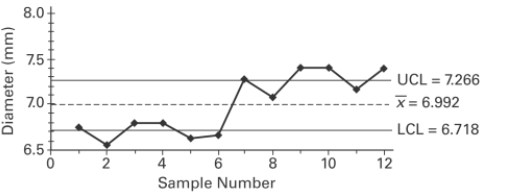
Definitions:
Related Questions
Q1: If z is a
Q4: The following residual plot is obtained after
Q6: <span class="ql-formula" data-value="y = 4 ( x
Q7: Construct a run chart for individual values
Q17: center <span class="ql-formula" data-value="( -
Q27: (7)(7)(7)<br>A)37<br>B)73<br>C)71<br>D)3 ·7
Q38: Why is <span class="ql-formula" data-value="s
Q46: Identify the null hypothesis, alternative hypothesis,
Q47: Use computer software to find the
Q198: -2 - (-17)+ (-5)<br>A)-24<br>B)-10<br>C)10<br>D)-14