Multiple Choice
Examine the given run chart or control chart and determine whether the process is within statistical control. 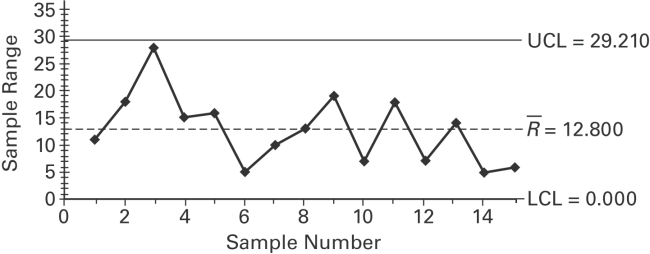
Apply time-driven activity-based costing techniques to various departments within a company.
Develop skills in preparing comprehensive cost analysis reports.
Evaluate the efficiency of departments based on cost allocations and capacity planning.
Understand the impact of cost allocations on customer service and order fulfillment strategies.
Definitions:
Related Questions
Q5: A run chart for individual values is
Q8: <span class="ql-formula" data-value="x ^ { 2 }
Q11: <img src="https://d2lvgg3v3hfg70.cloudfront.net/TB6914/.jpg" alt=" A) B)
Q24: <span class="ql-formula" data-value="y = - 3 x
Q36: Solve the problem. A hypothesis test
Q43: The probability that a radish seed will
Q48: Use computer software to obtain the
Q49: Find the critical value. Assume that
Q58: Match the parametric test with its comparable
Q62: <span class="ql-formula" data-value="f ( x ) =