The following scatterpolt shows the percentage of the vote a candidate received in the 2004 senatoral elections according to the voter's income level based on an exit poll of the voters conducted bu CNN. The income levels 1-8 correspond to the followng income classes: 1=under $15,00; 2=$15-30,000; 3=$30-50,000; 4=$50=75,000; 5=$75-100,000; 6=$100-150,000; 7=$150=200,000; 8=$200,000 or more.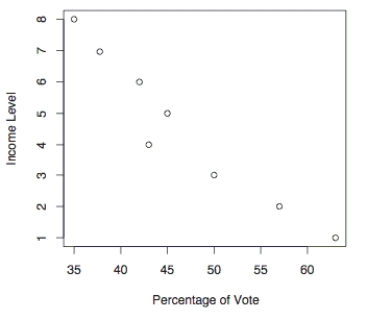
Use the election scatterplot to the find the critical values corresponding to a 0.01 significance level used to test the null hypothesis of Ps=0 .
Definitions:
Mean
A statistical measure referring to the average value in a set of numbers, calculated by dividing the sum of all values by the number of values.
Range
In statistics, the difference between the highest and lowest scores in a distribution, indicating dispersion or variability.
Inferential Statistic
A set of methods used to make inferences or predictions about a larger population based on data collected from a smaller sample.
P Value
A statistical measure that helps scientists determine the significance of their research results, reflecting the likelihood that the observed data could occur by chance.
Q9: How do you determine whether to
Q13: Use the given degree of confidence
Q16: (2)(-5)<br>A)-110<br>B)-10<br>C)-100<br>D)-12
Q29: The data below represent the weight
Q33: <span class="ql-formula" data-value="f ( x ) =
Q41: Suppose there is significant correlation between two
Q45: Why do researchers concentrate on explaining an
Q48: Examine the given run chart or control
Q55: Use the given information to find
Q125: <span class="ql-formula" data-value="\frac { 3 } {