Construct the indicated confidence interval for the difference between the two population means. Assume that the two samples are independent simple random samples selected from normally distributed populations. Also assume that the population standard deviations are equal , so that the standard error of the difference between means is obtained by pooling the sample variances. A paint manufacturer wanted to compare the drying times of two different types of paint. Independent simple random samples of 11 cans of type A and 9 cans of type B were selected and applied to similar surfaces. The drying times, in hours, were recorded. The summary statistics are as follows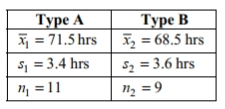
Construct a 99 % confidence interval for the difference between the mean drying time for paint type A and the mean drying time for paint type B.
Definitions:
Null Hypothesis
A statement in inferential statistics that there is no effect or no difference, and any observed deviation from this state is due to chance.
Rejection Level
The threshold or critical value that determines whether to reject the null hypothesis in statistical hypothesis testing, often denoted by alpha.
P-value
A measure in statistical hypothesis testing that quantifies the evidence against a null hypothesis, with lower values indicating stronger evidence.
Sample Mean
The average of a set of observations or values taken from a sample of a population.
Q1: Find the critical value. Assume that
Q5: Determine which of the four levels of
Q6: Find the value of the linear
Q18: If test A has an efficiency rating
Q25: Suppose that you wish to find
Q27: Explain the procedure for two-way analysis of
Q34: In a recent year, the U.S. Mint
Q39: Test the indicated claim about the variances
Q43: Formulate the indicated conclusion in nontechnical terms.
Q45: <span class="ql-formula" data-value="2 ^ { 9 }"><span