A normal quartile plot is given below for the weekly incomes (in dollars)of a sample of engineers in one town. Describe what each x value represents and what each y value
represents. Use the plot to assess the normality of the incomes of engineers in this town.
Explain your reasoning. 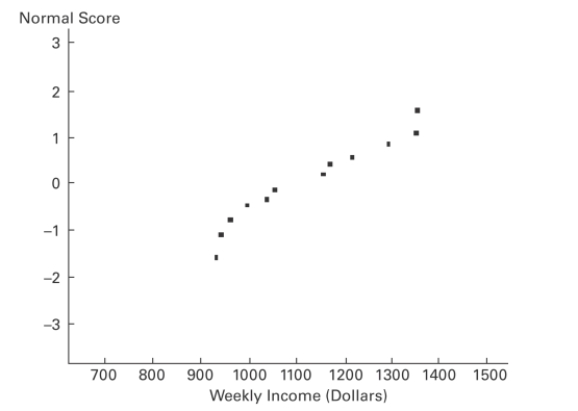
Definitions:
Q19: Suppose you are to test for
Q24: Find the explained variation for the
Q26: <span class="ql-formula" data-value="\mathbf { y } =
Q27: While conducting a goodness-of-fit test if the
Q31: The lengths of human pregnancies are normally
Q40: Examine the given run chart or control
Q43: Examine the given run chart or control
Q48: Assume that a crucial machine part has
Q50: Find the indicated z score. The
Q51: The Precision Scientific Instrument Company manufactures thermometers