Use the frequency distribution to answer the next questions. A sample of 272
log jams found in river channels in the Northwest U.S. is grouped into the resulting
frequency distribution based on the width of the channel in which the log jams
were found. 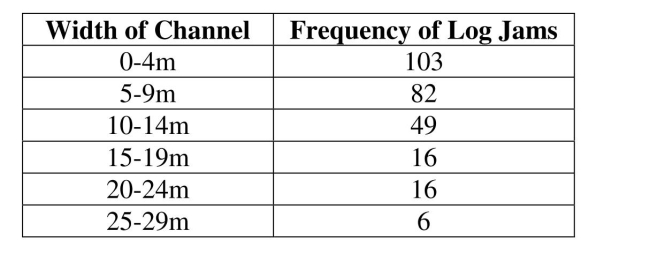
-Construct a corresponding histogram for the width of the channels.
Definitions:
Q1: Given: There is a linear correlation coefficient
Q3: In studying the Loggerhead turtle on Anna
Q3: Using the Empirical Rule, what is the
Q4: Identify the null hypothesis.
Q13: <span class="ql-formula" data-value="f ( x ) =
Q23: With <img src="https://d2lvgg3v3hfg70.cloudfront.net/TB2682/.jpg" alt="With " class="answers-bank-image
Q27: Identify the alternative hypothesis.
Q36: Determine the value of the <img src="https://d2lvgg3v3hfg70.cloudfront.net/TB2682/.jpg"
Q52: <span class="ql-formula" data-value="x ^ { 2 }
Q86: <span class="ql-formula" data-value="f ( x ) =