Essay
A control chart for is shown below._
statistical control. If it is not, identify which of the three out-of-control criteria lead to rejection
of a statistically stable mean. 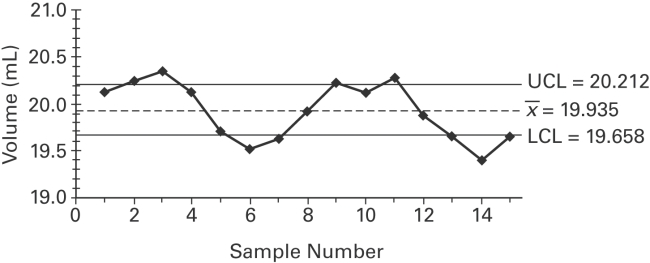
Learn the significance of practicing a speech to enhance delivery and presentation flow.
Comprehend the differences among various types of presentations (e.g., informative, goodwill, persuasive) and select the appropriate type for a given objective.
Recognize the importance of pitch, tone, and enunciation in effectively communicating your message to an audience.
Learn strategies for effectively utilizing technology and visuals to enhance presentation delivery.
Definitions:
Related Questions
Q11: A normal quartile plot is given below
Q20: Find the coefficient of determination, given that
Q42: <span class="ql-formula" data-value="\left\{ \begin{array} { c }
Q56: Construct the indicated confidence interval for
Q75: Describe the sign test. What types of
Q78: Use the data in the given
Q111: A control chart for <span
Q200: <span class="ql-formula" data-value="y \cdot y ^ {
Q210: <span class="ql-formula" data-value="\frac { - 3.3 }
Q212: 0.00000069904 <br>A) 6.9904 x 10<sup>6</sup><br>B)