A normal quartile plot is given below for the weekly incomes (in dollars)of a sample of
engineers in one town. Describe what each x value represents and what each y value
represents. Use the plot to assess the normality of the incomes of engineers in this town.
Explain your reasoning. 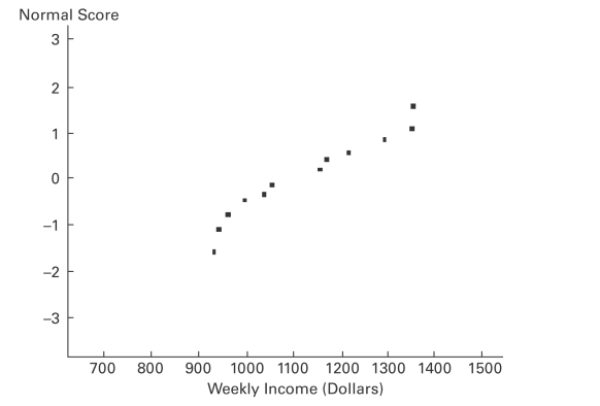
Definitions:
Chase Strategy
A planning strategy that sets production equal to forecasted demand.
Planning Horizons
The time period over which forecasts or plans are made, guiding strategic and operational decisions in an organization.
Demand Options
Various strategies a company can use to manage or influence customer demand for its products or services.
Q15: The following table describes the results
Q24: Three randomly selected households are surveyed as
Q26: The four levels of measurement that are
Q42: Provide an appropriate response. Describe what process
Q43: Females, on average, are shorter and
Q44: The margin of error _ _ (increases
Q46: An education expert is researching teaching methods
Q57: Test the given claim about the
Q61: Use the sign test to test
Q160: The following data contains task completion