Not Answered
Describe any similarities or differences in the two distributions represented by the following
boxplots. Assume the two boxplots have the same scale. 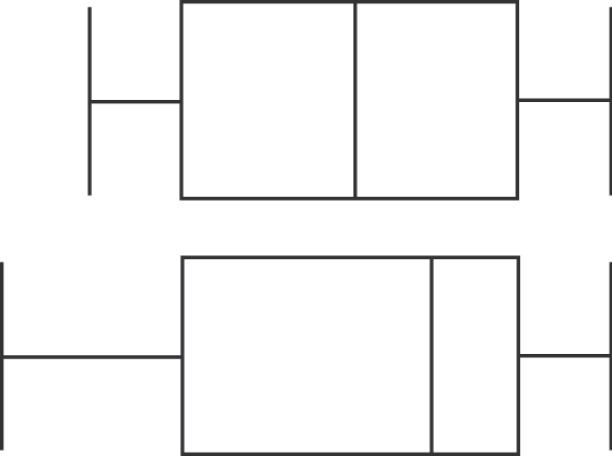
Definitions:
Related Questions
Q3: Select the correct interpretation of the probability
Q4: Assume that there is a change
Q6: Construct a scatterplot for the given
Q8: You have been asked by your
Q11: A normal quartile plot is given below
Q23: Multiple-choice questions on a test each have
Q36: The table below lists weights (carats)and
Q46: Give at least three examples from macroeconomics
Q50: Determine whether the given value is a
Q56: Determine whether the given description corresponds to