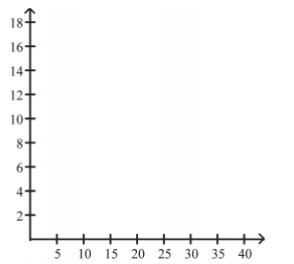
The data shows the roundtrip mileage that 43 randomly selected students drive to school_
each day. Construct a frequency polygon. Applying a loose interpretation of the requirements
for a normal distribution, do the mileages appear to be normally distributed? Why or why not? 
Definitions:
Decision Alternatives
Choices available to decision-makers in a given decision-making scenario.
Decision Trees
A graphical representation used for decision-making, showing various outcomes from a series of related choices, helping to weigh options and possible consequences.
Decision Tables
A tool used in both computer programming and business decision-making that represents the logic of decision making through a matrix of conditions and the actions to be taken.
Conditional Value
A numerical value assigned to an outcome in a decision-making process, dependent on specific conditions being met.
Q7: When there are <span class="ql-formula"
Q14: A(n)_ is a point lying far away
Q19: The table below shows the population
Q22: The textbook derived the following result:
Q22: Scores on a test are normally
Q26: The four levels of measurement that are
Q28: Under what circumstances can you replace
Q28: Scores on the SAT test have a
Q30: You want to estimate σ for
Q55: A die is rolled nine times and