The following two graphs give you a plot of the United States aggregate unemployment
rate for the sample period 1962:I to 1999:IV, and the (log)level of real United States
GDP for the sample period 1962:I to 1995:IV.You want test for stationarity in both
cases.Indicate whether or not you should include a time trend in your Augmented
Dickey-Fuller test and why. United States Unemployment Rate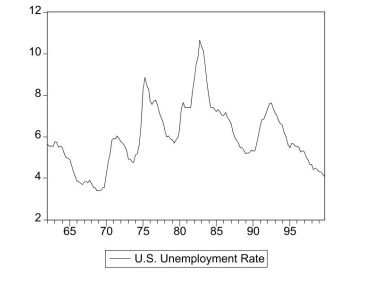
United States Real GDP (in logarithms)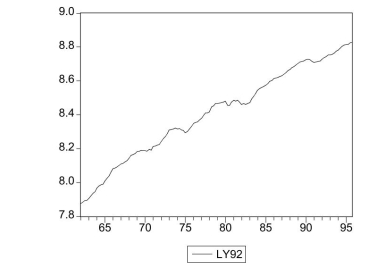
Definitions:
Accounts Payable
Short-term liabilities a company owes to its creditors or suppliers, expected to be settled within one year.
Bank Loan
A sum of money borrowed from a bank that needs to be repaid with interest.
Accrual
An accounting method that records revenues and expenses when they are incurred, regardless of when cash transactions occur.
Spontaneous Financing
Financing that arises naturally from the normal operations of a company, such as trade credit that increases automatically with increases in sales.
Q2: To choose the number of lags in
Q12: A distributed lag regression a. is
Q22: The following is not part of
Q24: Minimization of <span class="ql-formula"
Q27: Find the following probabilities:<br>(a) <span
Q34: The root mean squared forecast error
Q35: Negative autocorrelation in the change of a
Q35: The probability of an outcome<br>A)is the number
Q96: No math course is upper-level.
Q157: Studying is sufficient for passing.