The following two graphs give you a plot of the United States aggregate unemployment
rate for the sample period 1962:I to 1999:IV, and the (log)level of real United States
GDP for the sample period 1962:I to 1995:IV.You want test for stationarity in both
cases.Indicate whether or not you should include a time trend in your Augmented
Dickey-Fuller test and why. United States Unemployment Rate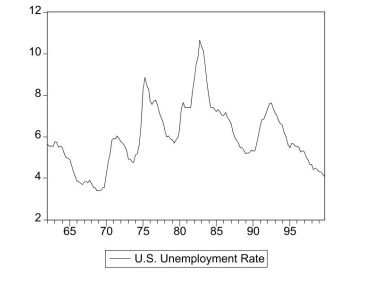
United States Real GDP (in logarithms)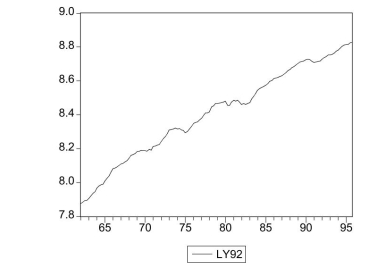
Definitions:
Breast Cancer
A type of cancer that develops from breast tissue, one of the most common cancers affecting women worldwide.
Hope And Optimism
Refers to the state of having a positive outlook and expectation for the future, which can significantly influence psychological well-being.
Demand Side
Refers to the consumers or buyers in an economy, focusing on their behavior and how their decisions affect market demand for goods and services.
Supply Side
Economic policies or theories emphasizing production incentives, tax reductions, and deregulation to drive economic growth by increasing supply.
Q6: The following will not cause correlation between
Q6: For this question you may assume
Q8: <span class="ql-formula" data-value="\mathcal { P } (
Q10: In the case of exact identification<br>A)you can
Q16: Reticence increases the likelihood of making verbal
Q18: (Requires Statistics background beyond Chapters 2
Q23: Your textbook has emphasized that testing
Q38: The mean of the sample average
Q53: You need to be registered in order
Q78: No freshman is a sophomore.