The diagram at the right is the Hasse diagram for a partially ordered set. Referring to this diagram:
(a) List the maximal elements
(b) List the minimal elements
(c) Find all upper bounds for f, g
(d) Find all lower bounds for d, f
(e) Find lub({g, j, m})
(f) Find glb({d, e})
(g) Find the greatest element
(h) Find the least element
(i) Use a topological sort to order the elements of the poset represented by this Hasse diagram.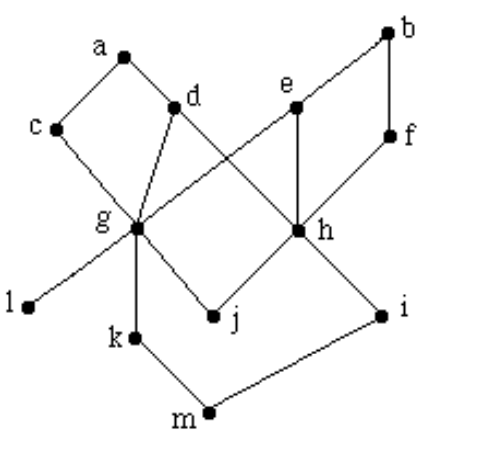
Definitions:
Inflation Rates
The percentage rate at which the general level of prices for goods and services is rising, and, subsequently, purchasing power is falling, usually measured over a specific period of time.
Inflation Rate
The percentage increase in the general price level of goods and services in an economy over a period of time, indicating the rate at which purchasing power is falling.
Money Demand
The desired holding of financial assets in the form of money; that is, cash or bank deposits.
Price Level
Price level is the average of current prices across the entire spectrum of goods and services produced in the economy, indicating inflation or deflation.
Q17: Suppose A={2,3,6,9,10,12,14,18,20} and R
Q18: Use the Principle of Mathematical Induction
Q33: Determine if 1101 belongs to the regular
Q36: The best comparison-based sorting algorithms for
Q55: Suppose <span class="ql-formula" data-value="| A
Q85: <span class="ql-formula" data-value="\sum _ { n =
Q89: In <span class="ql-formula" data-value="K _
Q110: <span class="ql-formula" data-value="a _ { n }
Q112: Use the binomial theorem to expand
Q124: Consider the recurrence relation <span