Solve the problem.
-The points shown in the graph represent the per capita consumption of chicken and beef in a country x years after the year 2000. Yearly Per Capita Consumption of Chicken and Beef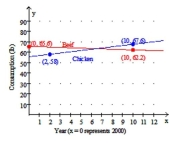
a. Use the given data points to write a linear function that approximates per capita consumption of Chicken C(x) (in lb) at a time x years since the year 2000.
b. Use the given data points to write a linear function that approximates per capita consumption of Beef B(x) (in lb) at a time x years since the year 2000.
c. Approximate the solution to the system of linear equations defined by the functions from parts (a)
And (b) . Round to 1 decimal place. Interpret the meaning of the solution to the system.
Definitions:
Reagents
Chemicals or compounds employed in chemical processes to identify, quantify, analyze, or create additional substances.
Chemically Treated
Describes objects or substances that have undergone treatment with chemicals, altering their properties for a specific purpose, such as preservation or cleaning.
Test Procedures
Defined protocols for conducting experiments or evaluations to obtain data on performance, quality, or safety.
Pipette
A laboratory tool used to transport a measured volume of liquid from one container to another.
Q2: <span class="ql-formula" data-value="\log _ { 9 }
Q24: <span class="ql-formula" data-value="\begin{array} { l } 0.6
Q47: <span class="ql-formula" data-value="\{ ( 4 z -
Q70: <span class="ql-formula" data-value="\frac { x ^ {
Q86: Given <span class="ql-formula" data-value="\frac {
Q94: <span class="ql-formula" data-value="\begin{aligned}- 9 x - 6
Q121: <span class="ql-formula" data-value="\log \left( \frac { m
Q131: <span class="ql-formula" data-value="\begin{aligned}x + y & <
Q151: <span class="ql-formula" data-value="\left[ \begin{array} { r r
Q220: Given a real number <span