Plot the point on a rectangular coordinate system.
-The figure represents the average credit card debt for selected households in Silerville. 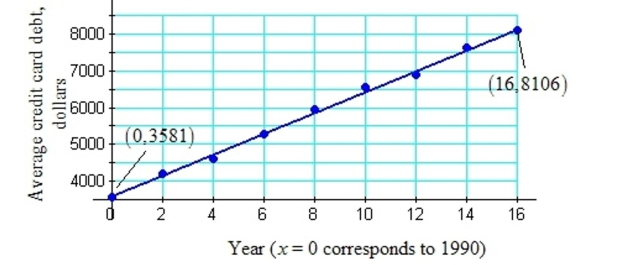
Let y represent the credit card debt in dollars. Let x represent the year, where x = 0 corresponds to the year 1990, x = 4 represents 1994, and so on.
a. Use the ordered pairs given in the graph, (0, 3581) and (16, 8106) to find a linear equation to estimate the
Average credit card debt versus the year. Round the slope to the nearest tenth.
b. Use the model from (a) to estimate the average debt in 2003. Round to the nearest dollar.
c. Interpret the slope of the model in the context of this problem.
Definitions:
Money Supply
The total amount of monetary assets available in an economy at a specific time, including cash, coins, and balances held in checking and savings accounts.
Inflation
The rate at which the general level of prices for goods and services is rising, eroding purchasing power.
Global Economy
An interconnected world economy where goods, services, and financial capital move across national borders, influenced by global events and policies.
Structural Reasons
Fundamental causes or conditions related to the organization or structure of a system, process, or entity.
Q20: <img src="https://d2lvgg3v3hfg70.cloudfront.net/TB7600/.jpg" alt="
Q58: N = {1, 2, 3, ...} is
Q66: <span class="ql-formula" data-value="f ( x ) =
Q176: If the graph of a polynomial function
Q177: A certain medicine is administered to animals
Q190: <span class="ql-formula" data-value="f ( x ) =
Q202: <span class="ql-formula" data-value="\frac { 6 - i
Q245: <span class="ql-formula" data-value="\frac { 11 } {
Q264: The length of a rectangle is
Q271: If <span class="ql-formula" data-value="x"><span class="katex"><span