Solve the problem.
-The graph shows the number of organ transplants in a certain country for the years 2005 to 2010 where represents the number of years since 2005 .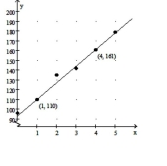
The linear model was created using the points and .
a. Interpret the meaning of the slope in the context of this problem.
b. Interpret the meaning of the -intercept in the context of this problem.
Definitions:
Q4: <span class="ql-formula" data-value="\sqrt { - 18 }"><span
Q10: The yearly depreciation rate for a
Q24: A rectangular garden covers <span
Q44: The notation <span class="ql-formula" data-value="x
Q72: <span class="ql-formula" data-value="4 x - 5 =
Q101: <span class="ql-formula" data-value="\begin{array} { l } y
Q170: <span class="ql-formula" data-value="x ^ { 2 }
Q180: <span class="ql-formula" data-value="X = \{ x \mid
Q187: <span class="ql-formula" data-value="- x ^ { 2
Q264: <span class="ql-formula" data-value="\left( - 3 x ^