Solve the problem.
-The graph shows the height h (in meters) of a roller coaster t seconds after the ride starts. 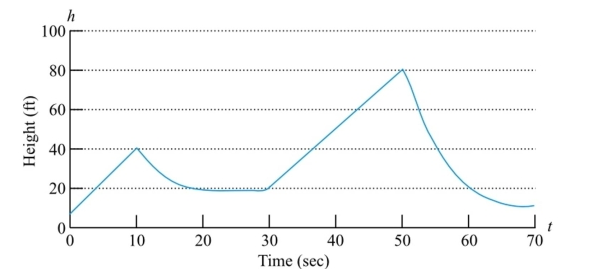
a. Over what interval(s) does the height increase?
b. Over what interval(s) does the height decrease?
Definitions:
Q23: <span class="ql-formula" data-value="0 . \overline { 15
Q114: <span class="ql-formula" data-value="\frac { 2 z }
Q142: <span class="ql-formula" data-value="2 x ( x -
Q182: <span class="ql-formula" data-value="f ( x ) =
Q187: <span class="ql-formula" data-value="f ( x ) =
Q238: <span class="ql-formula" data-value="f ( x ) =
Q260: <span class="ql-formula" data-value="f ( x ) =
Q266: A boat can travel 42 miles upstream
Q350: <span class="ql-formula" data-value="x = | y |
Q372: <img src="https://d2lvgg3v3hfg70.cloudfront.net/TB7600/.jpg" alt="