Solve the problem.
-The graph shows the number of organ transplants y in a certain country for the years 2005 to 2010 where x represents the number of years since 2005. 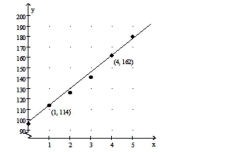
a. Use the points (1, 114) and (4, 162) to write a linear model for these data. Round the slope to one Decimal place and the y-intercept to the nearest whole unit.
b) Use the model to approximate the number of organ transplants performed in 2012.
Definitions:
Temporal Precedence
Part of causal inference; the cause occurs before the effect.
Workplace Lighting
The arrangement and type of lighting in a work environment, which can affect productivity, comfort, and safety of workers.
Employee Productivity
A measure of the efficiency of a worker or a group of workers in producing goods or services.
Dependent Variable
The outcome variable researchers are interested in measuring or predicting, which is believed to depend on one or more independent variables.
Q14: <span class="ql-formula" data-value="- 3 . \overline {
Q75: Tetanus bacillus bacteria are cultured to
Q116: <span class="ql-formula" data-value="( 4 y + 7
Q163: <span class="ql-formula" data-value="6 x ( x -
Q209: The variable s varies indirectly as
Q243: <span class="ql-formula" data-value="f ( x ) =
Q265: <span class="ql-formula" data-value="f ( x ) =
Q282: <span class="ql-formula" data-value="- 15 = - 11
Q283: <span class="ql-formula" data-value="f ( x ) =
Q375: A function defined by f (x) =