Solve the problem.
-Use the following graph which shows the number of customer service calls to a major appliance Manufacturer, in millions, for the years 2006-2012. Use the graph to represent the set in roster Form. 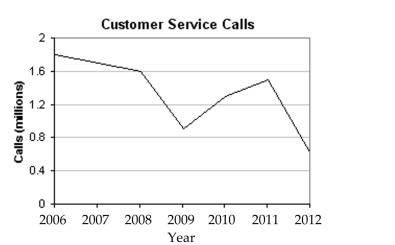
The set of years in which the number of customer service calls exceeded 1.1 million.
Definitions:
Network Theories
Explain the frameworks and principles that describe how networks form, operate, and evolve. These include social, informational, and biological networks.
Reconstruct Information
The process of piecing together fragmented data or knowledge to form a coherent understanding.
Encoding
The process of converting information into a form that can be stored in memory.
Storage
The act or process of keeping data, objects, or materials in a location for future use, preservation, or retrieval.
Q8: A country with two states has
Q19: Computer Specialists is planning a group vacation
Q28: If you are dealt two cards
Q55: 13,562 to base 8<br>A) <span class="ql-formula"
Q78: <span class="ql-formula" data-value="\begin{array} { l } \mathrm
Q86: <span class="ql-formula" data-value="(P \wedge \sim t) \wedge
Q87: If a single fair die is
Q114: 873110 to base 16 <br>A)
Q124: <img src="https://d2lvgg3v3hfg70.cloudfront.net/TB3046/.jpg" alt="
Q134: <span class="ql-formula" data-value="\begin{array}{l}\text { Planet X }\\\begin{array}