A very large study of college students' study habits found that the time (in hours) thatfreshmen study each week is approximately normal with mean 24 hours and standarddeviation 8 hours. Consider random samples of size 16 from the population of freshmen.
a) On the axes below, sketch curves representing the distribution of the original populationand the sampling distribution of for samples of size n =16 . Be sure to indicate whichcurve is which. What are the mean and standard deviation of the sampling distributionof ?
b) What is the probability that a sample of size n = 16 from this population would result ina sample mean greater than 30 hours?
The study of college freshmen also asked about the students' time spent playing video games.Suppose that the population relative frequency histogram for time spend playing video games isas shown below. The mean amount of time spent playing video games was 0.8 hours per week.Relative Frequency 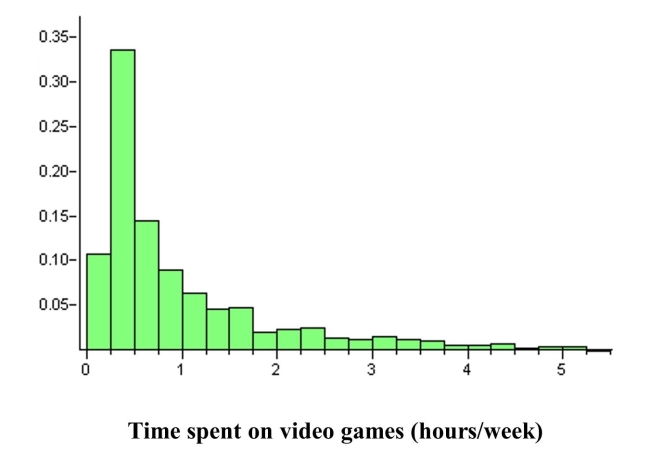
c) Suppose you were to take a random sample, n = 4, from this population of freshmen andask them how much time they spent playing video games per week. Describe the shape,center, and spread of the sampling distribution of , as compared to the populationdistribution.
Definitions:
Contaminated Cola
A scenario where a cola or soft drink becomes impure or unsafe for consumption due to the presence of harmful substances.
Audited Financial Statements
Financial reports (income statement, balance sheet, and cash flow statement) of a company that have been reviewed and certified by a certified public accountant (CPA) to ensure accuracy and compliance with accounting standards.
Battery Contamination
The leakage or spilling of harmful substances from batteries, which can cause environmental damage and pose health risks.
Breach of Contract
An act of failing to fulfill the terms agreed upon in a contract, leading to legal action for enforcement or damages.
Q1: All other things being equal, choosing a
Q1: The variance is the positive square root
Q8: The mean value of the statistic b
Q9: The expected cell count for the row
Q16: A consumer group is performing an experiment
Q17: For small samples, the margin of
Q30: A pie chart is most useful for
Q36: <span class="ql-formula" data-value="- 14 a ^ {
Q42: A landscaping company buys a new bulldozer
Q109: 10xy, 10x<sup>2</sup>, 12xy<sup>2</sup>, and 6y<sup>2</sup><br>A) 4<br>B) 2x<br>C)