Multiple Choice
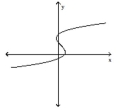
Use the vertical line test to determine whether or not the graph is a graph of a function.
-
Definitions:
Related Questions
Q6: Approximately 68% of observations are within 2
Q14: <span class="ql-formula" data-value="\frac { 6 y -
Q19: The row and column marginal totals provide
Q27: A hypothesis test uses population data to
Q28: What is the probability that the selected
Q28: When using histograms to compare groups of
Q33: ? is also sometimes called the observed
Q52: <span class="ql-formula" data-value="48 x ^ { 3
Q93: <span class="ql-formula" data-value="\left\{ \begin{array} { l }
Q94: <span class="ql-formula" data-value="y ^ { 10 }