Multiple Choice
The graph below shows the percentage of students enrolled in the College of Engineering at State University. Use the graph to
answer the question. 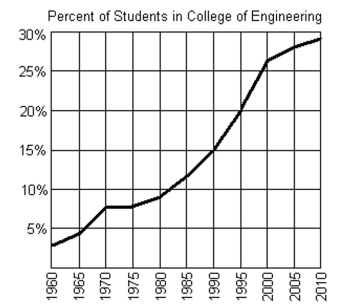
-If f(x) = 15%, what year is represented by x?
Definitions:
Related Questions
Q16: <span class="ql-formula" data-value="f ( x ) =
Q16: Inferences about the difference between two means
Q19: What is the best fit line using
Q24: In a few sentences, describe the difference
Q26: <span class="ql-formula" data-value="( 6 x + 2
Q57: <span class="ql-formula" data-value="\left\{ \begin{array} { l }
Q70: <span class="ql-formula" data-value="- 10 x ^ {
Q91: <span class="ql-formula" data-value="20 \mathrm { x }
Q105: <span class="ql-formula" data-value="\frac { r ^ {
Q124: <span class="ql-formula" data-value="\frac { x + 2