The pie chart below shows the number of pizzas consumed by college students in a typical month. Use the chart to
answer the question. 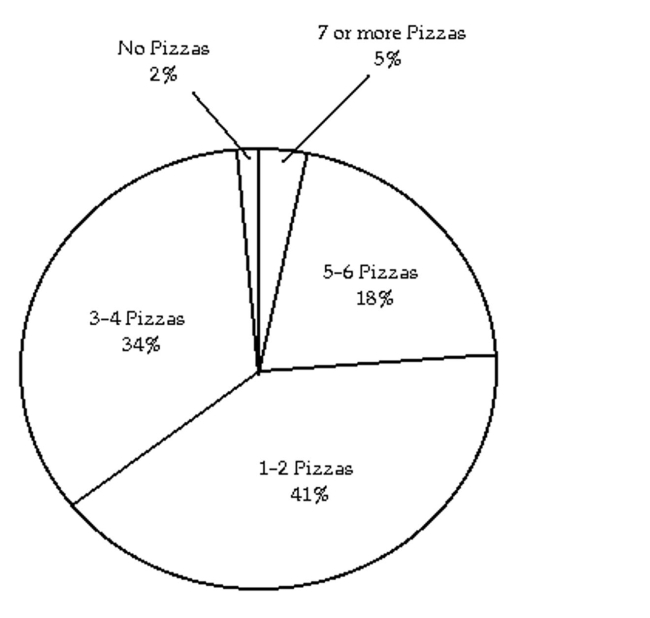
-If State University has approximately 25,000 students, about how many would you expect to consume 5-6 pizzas in a typical month?
Definitions:
Tax Amount
The total sum of money required by a government from individuals or businesses as a form of revenue.
Deadweight Loss
A loss of economic efficiency that can occur when the free market equilibrium for a good or a service is not achieved.
Excise Tax
A tax charged on specific goods, services, and activities, such as gasoline, alcohol, and gambling.
Tax Burden
The impact of taxation on an individual or entity, often measured as a proportion of income or revenue.
Q12: How many months after the company doubled
Q23: <span class="ql-formula" data-value="\begin{array} { l } 3
Q38: The square painting in the figure
Q39: Find the sum of the first 4
Q49: <span class="ql-formula" data-value="( 2 x - 10
Q73: <span class="ql-formula" data-value="3 + 6 + 9
Q75: 60 - y = 10; 60<br>A) solution<br>B)
Q78: <span class="ql-formula" data-value="\begin{array} { r } x
Q81: <span class="ql-formula" data-value="x ^ { 7 }
Q247: A new firm loses $3600 in its