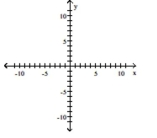
Draw the graph of the equation.
- 
Definitions:
Sample Coefficient of Correlation
A measure indicating the degree and direction of linear relationship between two quantitative variables within a sample.
Estimated Regression Line
A line calculated from sample data that best fits the scatterplot of the data points, used to make predictions.
Total Variation
The sum of squared differences between individual observations and the overall mean of a data set.
Dependent Variable
The variable in an experiment or study that is expected to change in response to changes in the predictor variables.
Q9: A rectangular plot has area 126
Q15: <span class="ql-formula" data-value="y = 8 x +
Q43: <span class="ql-formula" data-value="A = \left[ \begin{array} {
Q53: <span class="ql-formula" data-value="B = \left\{ 4 ,
Q67: <span class="ql-formula" data-value="\left\{ \begin{array} { c }
Q88: <span class="ql-formula" data-value="f ( x ) =
Q103: <span class="ql-formula" data-value="( 3 x + 1
Q131: <span class="ql-formula" data-value="a _ { n }
Q182: <span class="ql-formula" data-value="x=y^{2}+4 y-3"><span class="katex"><span class="katex-mathml"><math xmlns="http://www.w3.org/1998/Math/MathML"><semantics><mrow><mi>x</mi><mo>=</mo><msup><mi>y</mi><mn>2</mn></msup><mo>+</mo><mn>4</mn><mi>y</mi><mo>−</mo><mn>3</mn></mrow><annotation
Q187: John does 12 pushups on the first