A study was conducted to test the effectiveness of supermarket sales strategies. At one supermarket, the price level (regular, reduced price, and at cost to supermarket) and display level (normal display space, normal display space plus end-of-aisle display, and twice the normal display space) were tested to determine if they had any effect on the weekly sales of a particular supermarket product. Each of the combinations of price level and display level were put in place for a randomly selected week and the weekly sales of the product was recorded. Each combination was used three times over the course of the experiment. The results of the study are shown here: 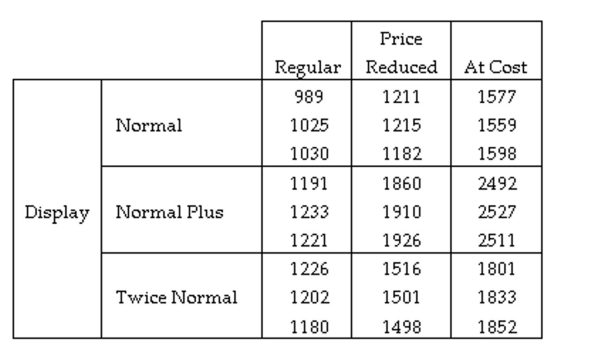
Find the test statistic for determining whether the interaction between Price and Display is significant.
Definitions:
Interns
Individuals, often students or recent graduates, who work temporarily, sometimes without pay, to gain hands-on experience in their field of interest.
Simulators
Devices or programs that replicate the conditions of a real-life process, used for training or research purposes.
Work Environment
The physical and psychological conditions under which employees perform their job duties.
Constant Updating
The continuous process of keeping systems, skills, and processes current and relevant in response to changing conditions and advancements.
Q18: The minimum-variance unbiased estimator (MVUE) has the
Q48: A newspaper reported on the topics that
Q66: A scientist is hoping to compare the
Q87: A company claims that 9 out of
Q96: A marketing study was conducted to
Q168: <span class="ql-formula" data-value="7 \sqrt { 5 }
Q230: <span class="ql-formula" data-value="\left( \frac { 4 }
Q315: <span class="ql-formula" data-value="\frac { 7 } {
Q355: <span class="ql-formula" data-value="- ( - 2 )
Q537: <span class="ql-formula" data-value="\left( \frac { x }