Data has been collected and a normal probability plot for one of the variables is shown below. Based on your knowledge of normal probability plots, do you believe the variable in question is normally distributed? The data are represented by the"o" symbols in the plot. 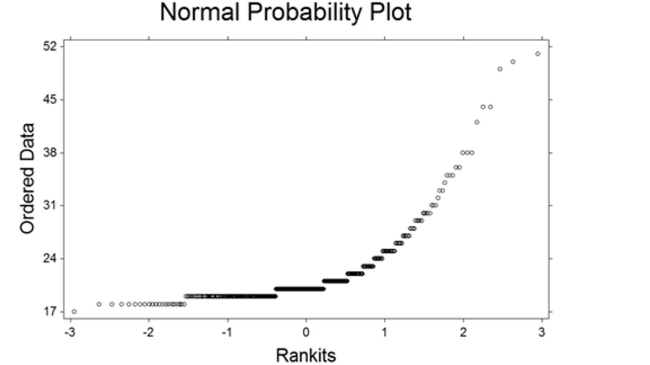
Definitions:
Q3: <span class="ql-formula" data-value="\text { Evaluate } \left(
Q8: A local consumer reporter wants to
Q43: Suppose a random sample of
Q64: A basketball player has an 80% chance
Q84: An industrial psychologist is investigating the effects
Q95: The owners of an industrial plant
Q96: Suppose <span class="ql-formula" data-value="x"><span class="katex"><span
Q98: According to an advertisement, a strain
Q159: Suppose a man has ordered twelve
Q235: An event and its complement are mutually