Match the given function to its graph.
-1)
2)
3)
4)
A.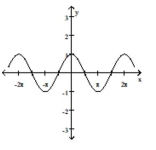
B.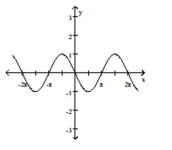
C.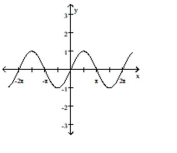
D.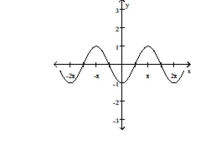
Definitions:
Box and Whisker Plot
A graphical representation of data that highlights the median, quartiles, and extremes of the dataset.
Five-number Summary
A statistical summary of a data set that includes the minimum, first quartile, median, third quartile, and maximum.
30th Percentile
A value below which 30 percent of the data falls, used to indicate the lower-middle range of a data set.
Interquartile Range
The difference between the 75th and 25th percentiles of a dataset, a measure of statistical dispersion.
Q74: The seasonal variation in the length
Q106: <span class="ql-formula" data-value="\cos ( x - y
Q144: <span class="ql-formula" data-value="f ( x ) =
Q211: <span class="ql-formula" data-value="\tan 930 ^ { \circ
Q264: <img src="https://d2lvgg3v3hfg70.cloudfront.net/TB6901/.jpg" alt=" A)
Q282: <span class="ql-formula" data-value="e ^ { x }
Q294: <span class="ql-formula" data-value="f(x)=4^{(x-1)}"><span class="katex"><span class="katex-mathml"><math xmlns="http://www.w3.org/1998/Math/MathML"><semantics><mrow><mi>f</mi><mo stretchy="false">(</mo><mi>x</mi><mo
Q326: If <span class="ql-formula" data-value="\cos \theta
Q337: <span class="ql-formula" data-value="\log _ { 6.9 }
Q343: <img src="https://d2lvgg3v3hfg70.cloudfront.net/TB6901/.jpg" alt=" A)