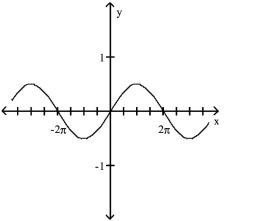
Understand the Graphs of y = csc x and y = sec x
Use the graph to obtain the graph of the reciprocal function. Give the equation of the function for the graph that
you obtain.
- 
Definitions:
Estimated Regression Equation
An equation derived from regression analysis that estimates the relationship between variables.
Independent Variable
A variable presumed to influence or determine the dependent variable in an experiment or study.
Coefficient of Determination
A statistical measure that determines the proportion of variance in the dependent variable that can be predicted from the independent variable(s).
Quadratic Model
A statistical or mathematical model in which the relationship between the independent variable and the dependent variable is represented by a second-degree polynomial or parabolic function.
Q47: <span class="ql-formula" data-value="f ( x ) =
Q81: <span class="ql-formula" data-value="\sec ( - \pi )"><span
Q85: <img src="https://d2lvgg3v3hfg70.cloudfront.net/TB7044/.jpg" alt=" A)
Q111: <span class="ql-formula" data-value="\mathrm { r } =
Q114: <span class="ql-formula" data-value="\sin \frac { 9 x
Q124: <span class="ql-formula" data-value="\cos \left( x - \frac
Q132: <span class="ql-formula" data-value="\sin \theta = \frac {
Q150: <img src="https://d2lvgg3v3hfg70.cloudfront.net/TB7044/.jpg" alt=" A)
Q220: <span class="ql-formula" data-value="\log _ { 3 }
Q294: <span class="ql-formula" data-value="f ( x ) =