Write the word or phrase that best completes each statement or answers the question.
Present data in the form of tables. For the data set shown by the table,
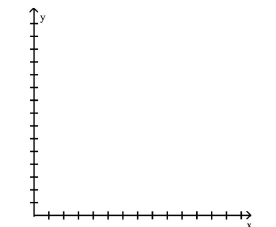
a. Create a scatter plot for the data.
b. Use the scatter plot to determine whether an exponential function or a logarithmic function is the best
choice for modeling the data.
-Percentage of Population Living in the
South Suburbs of a Large City
\begin{tabular} { c | c }
Year & Percent \\
\hline 1950 & 55 \\
1960 & 70 \\
1970 & 74 \\
1980 & 75 \\
2000 & 76
\end{tabular}
Definitions:
Histogram
A graphical representation of data that groups numbers into ranges, showing the frequency of data points within those ranges as bars.
Frequency Distribution
A statistical representation showing the number of observations within different intervals or categories.
Histogram
A graphical representation of distributed data using bars of different heights to show the frequency of data points in specific intervals.
Frequency Distribution
A statistical representation showing how often each different value in a set of data occurs.
Q65: <span class="ql-formula" data-value="\text { Use the graph
Q79: <img src="https://d2lvgg3v3hfg70.cloudfront.net/TB7044/.jpg" alt=" A)
Q96: <span class="ql-formula" data-value="e ^ { 4 x
Q149: <span class="ql-formula" data-value="f ( x ) =
Q169: <span class="ql-formula" data-value="h ( x ) =
Q181: <span class="ql-formula" data-value="\log _ { 8 }
Q266: Find the accumulated value of an investment
Q268: <span class="ql-formula" data-value="x ^ { 3 }
Q433: <span class="ql-formula" data-value="f ( x ) =
Q517: <span class="ql-formula" data-value="f ( x ) =