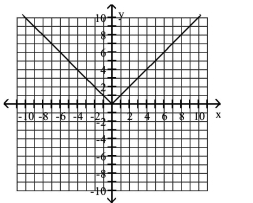
Use the graph of the function f, plotted with a solid line, to sketch the graph of the given function g.
- 
Definitions:
Q37: <span class="ql-formula" data-value="\mathrm { y } =
Q49: <span class="ql-formula" data-value="f ( x ) =
Q58: <span class="ql-formula" data-value="h ( x ) =
Q136: <span class="ql-formula" data-value="f ( x ) =
Q276: <span class="ql-formula" data-value="\frac { 10 \mathrm {
Q306: <span class="ql-formula" data-value="\sqrt { - 16 }
Q325: <span class="ql-formula" data-value="x ^ { 2 }
Q398: <span class="ql-formula" data-value="\frac { 3 x }
Q466: <span class="ql-formula" data-value="t"><span class="katex"><span class="katex-mathml"><math xmlns="http://www.w3.org/1998/Math/MathML"><semantics><mrow><mi>t</mi></mrow><annotation encoding="application/x-tex">t</annotation></semantics></math></span><span
Q520: <span class="ql-formula" data-value="f ( x ) =