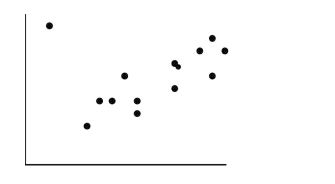
If the point in the upper left corner of the scatterplot shown below is removed,
What will happen to the correlation (r) and the slope of the line of best fit (b) ? 
Definitions:
Q1: A company's manufacturing process uses 500 gallons
Q21: Shown below is a correlation table
Q24: Data were collected on the hourly wage
Q25: Which of the following is not an
Q35: For each of the following scenarios indicate
Q234: <span class="ql-formula" data-value="y _ { 1 }
Q239: <span class="ql-formula" data-value="y=x^{2}+2"><span class="katex"><span class="katex-mathml"><math xmlns="http://www.w3.org/1998/Math/MathML"><semantics><mrow><mi>y</mi><mo>=</mo><msup><mi>x</mi><mn>2</mn></msup><mo>+</mo><mn>2</mn></mrow><annotation encoding="application/x-tex">y=x^{2}+2</annotation></semantics></math></span><span
Q262: <span class="ql-formula" data-value="P = \frac { A
Q333: The U.S. Maritime Administration estimated that
Q342: <span class="ql-formula" data-value="x ^ { 2 }