Interpret displays of distributions.
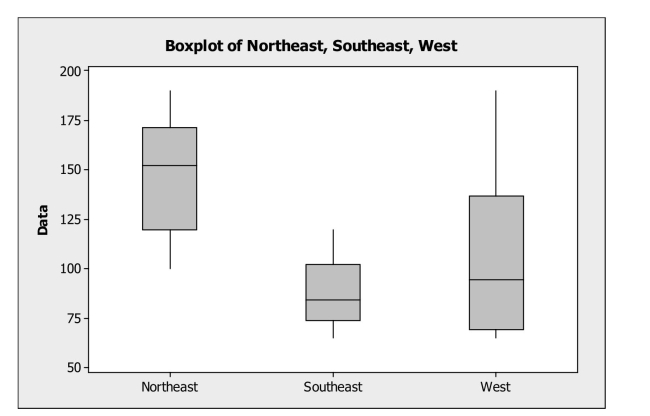
-The following boxplots show monthly sales revenue figures ($ thousands) for a
Discount office supply company with locations in three different regions of the U.S.
(Northeast, Southeast, and West) . Which of the following statements is false? 
Definitions:
Q1: Scanner data gathered from various supermarket chains
Q8: What scale of measurement is the style
Q11: An automatic filling process is used to
Q12: The scatterplot shows monthly sales figures (in
Q17: A fast food restaurant just leased a
Q42: <span class="ql-formula" data-value="x ^ { 2 /
Q103: Referring to Scenario 19-6, how many possible
Q121: The risk- _ curve represents the expected
Q305: <span class="ql-formula" data-value="x ^ { 2 }
Q390: <span class="ql-formula" data-value="y = | 2 x