SCENARIO 17-8
The superintendent of a school district wanted to predict the percentage of students passing a sixth-
grade proficiency test. She obtained the data on percentage of students passing the proficiency test
(% Passing), daily mean of the percentage of students attending class (% Attendance), mean teacher
salary in dollars (Salaries), and instructional spending per pupil in dollars (Spending) of 47 schools in
the state. Following is the multiple regression output with Passing as the dependent variable, Attendance, Salaries and Spending:
ANOVA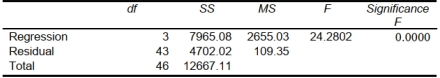
-Referring to Scenario 17-8, there is sufficient evidence that the percentage of
students passing the proficiency test depends on all of the explanatory variables at a 5% level of
significance.
Definitions:
Conglomerate
A large corporation that owns a collection of different companies in various sectors or industries.
Return Rate
The profit or deficit experienced by an investment during a certain period, represented as a portion of the initial investment's value.
Market Economy
An economic system in which economic decisions and the pricing of goods and services are guided solely by the aggregate interactions of a country's citizens and businesses and not by government intervention.
Investment Project
A project undertaken by individuals, companies, or governments aiming at generating future profits through capital expenditure.
Q3: A recent poll of 120 adults who
Q13: In a metal fabrication process, metal rods
Q39: Referring to Scenario 17-6, which of
Q76: Referring to Scenario 17-13, the sparklines enable
Q89: Poke-Yoke devices establish ways to clean and
Q98: Referring to Scenario 17-12, what is the
Q120: An agronomist wants to compare the crop
Q147: The SS method establishes ways to eliminate
Q195: Referring to Scenario 17-10 Model 1,
Q376: Referring to Scenario 17-9, the 0 to