SCENARIO 17-15
The tree diagram below shows the results of the classification tree model that has been constructed to
predict the probability of a cable company's customers who will switch ("Yes" or "No") into its
bundled program offering based on the price ($30, $40, $50, $60) and whether the customer spends
more than 5 hours a day watching TV ("Yes" or "No") using the data set of 100 customers collected
from a survey. 
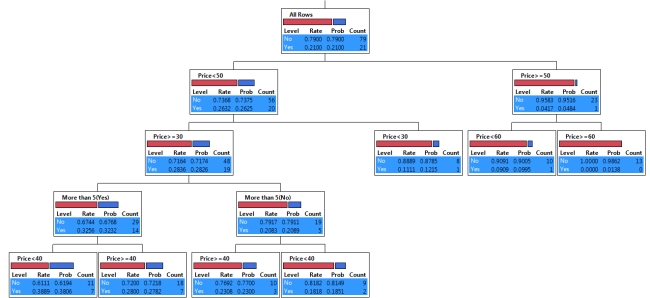
-Referring to Scenario 17-15, the highest probability of switching is predicted to
occur among customers who do not watch more than 5 hours of TV a day and are offered the
bundled price of lower than $50.
Definitions:
Net Profit Margin Ratio
An indicator of profitability, calculated as net income divided by revenue.
Total Asset Turnover
A financial gauge assessing how well a company employs its assets to create sales turnover.
Cash Dividend
A payout in cash form from a corporation's profits to the individuals holding its shares.
Stockholders' Equity
Stockholders' equity represents the ownership interest of shareholders in the assets of a corporation, after deducting liabilities.
Q18: Referring to Scenario 17-1, what is the
Q29: Referring to Scenario 18-8, based on the
Q45: Referring to Scenario 18-7, construct an R
Q53: Referring to Scenario 15-6, the model that
Q123: Referring to Scenario 15-6, the variable X1
Q149: Referring to Scenario 16-5, the number of
Q166: Referring to Scenario 16-15-A, what is your
Q199: Referring to Scenario 14-2, suppose an employee
Q211: Referring to Scenario 17-9, what is the
Q349: A political pollster randomly selects a sample