SCENARIO 16-13
Given below is the monthly time series data for U.S. retail sales of building materials over a
specific year. Month 123456789101112 Retail Sales 6,5946,6108,1749,51310,59510,4159,9499,8109,6379,7329,2149,201 The results of the linear trend, quadratic trend, exponential trend, first-order autoregressive,
second-order autoregressive and third-order autoregressive model are presented below in which
the coded month for the 1st month is 0: Linear trend model:
Intercept Coded Month Coefficients 7950.7564212.6503 Standard Error 617.634295.1145 t Stat 12.87292.2357 P-value 0.00000.0494
Quadratic trend model:
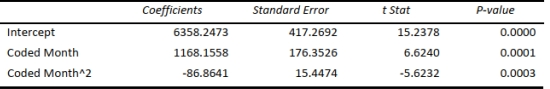
Exponential trend model:
Intercept Coded Month Coefficients 3.89120.0116 Standard Error 0.03150.0049 t Stat 123.36742.3957 P-value 0.00000.0376
First-order autoregressive:
Intercept YLag1 Coefficients 3132.09510.6823 Standard Error 1287.28990.1398t Stat 2.43314.8812 P-value 0.03780.0009
-Referring to Scenario 16-13, what is your forecast for the 13th month using the linear-trend
model?
Definitions:
Service Support
Assistance and resources provided by a company to the users of its products or services.
Cutting-edge Technology
The latest and most advanced technology available in a field or industry.
Benefits-sought
Benefits-sought describes the specific value or advantage consumers look for in a product or service, driving their purchasing decisions.
Descriptive Variables
Variables that are used to summarize or describe characteristics of a set of data.