SCENARIO 16-13
Given below is the monthly time series data for U.S. retail sales of building materials over a
specific year. Month 123456789101112 Retail Sales 6,5946,6108,1749,51310,59510,4159,9499,8109,6379,7329,2149,201 The results of the linear trend, quadratic trend, exponential trend, first-order autoregressive,
second-order autoregressive and third-order autoregressive model are presented below in which
the coded month for the 1st month is 0: Linear trend model:
Intercept Coded Month Coefficients 7950.7564212.6503 Standard Error 617.634295.1145 t Stat 12.87292.2357 P-value 0.00000.0494
Quadratic trend model:
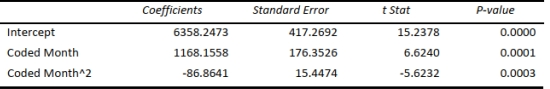
Exponential trend model:
Intercept Coded Month Coefficients 3.89120.0116 Standard Error 0.03150.0049 t Stat 123.36742.3957 P-value 0.00000.0376
First-order autoregressive:
Intercept YLag1 Coefficients 3132.09510.6823 Standard Error 1287.28990.1398t Stat 2.43314.8812 P-value 0.03780.0009
-Referring to Scenario 16-13, what is your forecast for the 13th month using the first-order
autoregressive model?
Understand the relationship between sales and production budgeting.
Calculate ending inventory levels based on sales budget projections.
Prepare a sales budget incorporating inventory considerations.
Understand the importance of maintaining inventory buffer for production components.
Definitions:
Divorce Rate
A statistical measure representing the frequency of divorces in a population over a certain period of time, often calculated per 1,000 individuals in the population.
Cohabit
To live together in a shared dwelling, typically referring to a couple who are not legally married.
Traditional Views
Perspectives or beliefs that emphasize values, practices, and norms established and maintained over long historical periods, often resistant to change.
Polygamy
Marriage in which a person has more than one spouse and is permitted sexual access to each of them.