SCENARIO 16-13
Given below is the monthly time series data for U.S.retail sales of building materials over a specific year.
 The results of the linear trend,quadratic trend,exponential trend,first-order autoregressive,second-order autoregressive and third-order autoregressive model are presented below in which the coded month for the 1st month is 0:
Linear trend model:

Quadratic trend model:


 Third-order autoregressive::

Below is the residual plot of the various models:
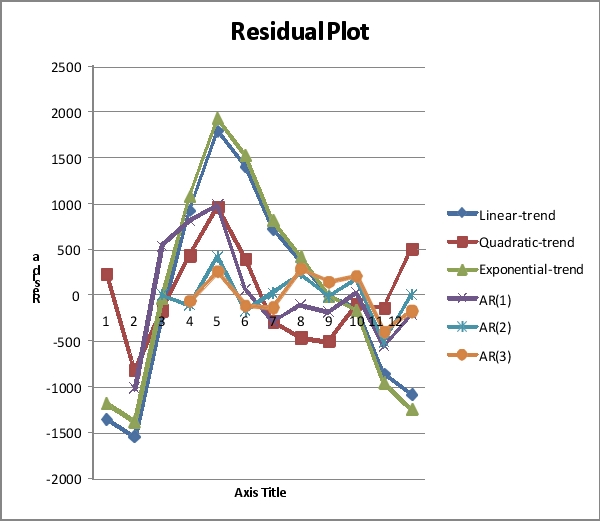
-Referring to Scenario 16-13,the best model based on the residual plots is the quadratic-trend regression model.
Definitions:
Sharecroppers
Laborers who farm land owned by another person and pay rent either in cash or as a portion of the crop, commonly in the post-Civil War South in the United States.
Cotton
A soft, fluffy staple fiber that grows in a boll around the seeds of cotton plants, used in the textile industry.
Cotton Production
The cultivation and harvesting of cotton plants, primarily for the textile industry, historically a major driver of the economy, especially in the American South.
Q54: Referring to Scenario 16-6, the forecast for
Q70: Referring to Scenario 14-15, which of
Q85: Referring to Scenario 14-7, the estimate
Q122: A multiple regression is called "multiple" because
Q155: Referring to Scenario 16-15-B, what is your
Q156: Referring to Scenario 16-15-B, what is your
Q182: Referring to Scenario 16-1, does there appear
Q193: Referring to Scenario 16-15-B, if a five-year
Q324: A Paso Robles wine producer wanted to
Q333: Referring to Scenario 17-12, there is not