SCENARIO 14-8 A financial analyst wanted to examine the relationship between salary (in ) and 2 variables: age and experience in the field Exper). He took a sample of 20 employees and obtained the following Microsoft Excel output:
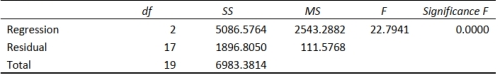
Also the sum of squares due to the regression for the model that includes only Age is 5022.0654 while the
sum of squares due to the regression for the model that includes only Exper is 125.9848.
-Referring to Scenario 14-8, the analyst wants to use a t test to test for the significance of the
coefficient of X2. For a level of significance of 0.01, the critical values of the test are ________.
Definitions:
Gross Method
An accounting method for recording purchases at the total invoice cost without deducting any cash discounts at the time of purchase.
Perpetual Inventory System
An accounting method that continuously updates the quantity and cost of inventory as purchases and sales are made.
Merchandise
Products or goods that are bought, sold, or traded within the retail or wholesale market.
Inventory Shrinkage
The loss of products between purchase from supplier and sale to customer, often due to theft, damage, or errors.
Q21: Referring to Scenario 15-7-B, the model
Q48: Referring to Scenario 16-11, using the first-order
Q127: Referring to Scenario 16-14, the best
Q131: Referring to Scenario 16-15-A, you can reject
Q166: Referring to Scenario 14-3, what is the
Q242: A regression had the following results: SST
Q302: Referring to Scenario 14-16, which of the
Q333: Referring to Scenario 14-2, for these
Q363: Referring to Scenario 14-8, the partial
Q367: Referring to Scenario 14-14, the fitted model