SCENARIO 14-15
The superintendent of a school district wanted to predict the percentage of students passing a sixth-
grade proficiency test. She obtained the data on percentage of students passing the proficiency test
(% Passing), mean teacher salary in thousands of dollars (Salaries), and instructional spending per
pupil in thousands of dollars (Spending) of 47 schools in the state. Following is the multiple regression output with Passing as the dependent variable,
Salaries and Spending:
ANOVA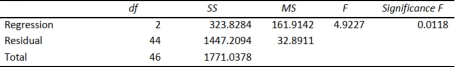
-Referring to Scenario 14-15, you can conclude definitively that instructional
spending per pupil individually has no impact on the mean percentage of students passing the
proficiency test, taking into account the effect of mean teacher salary, at a 1% level of
significance based solely on but not actually computing the 99% the confidence interval estimate
for .
Definitions:
Q6: Referring to Scenario 16-13, what is
Q60: Referring to Scenario 13-12, there is sufficient
Q83: Referring to Scenario 14-20-A, the predicted total
Q86: When an additional explanatory variable is introduced
Q131: Referring to Scenario 16-15-A, you can reject
Q141: Referring to Scenario 12-8, at 5% level
Q146: Referring to Scenario 14-15, which of the
Q161: You give a pre-employment examination to your
Q185: Referring to Scenario 16-12, the best interpretation
Q306: Referring to Scenario 14-16, _ of the