SCENARIO 14-17
Given below are results from the regression analysis where the dependent variable is the number of
weeks a worker is unemployed due to a layoff (Unemploy) and the independent variables are the age
of the worker (Age) and a dummy variable for management position (Manager: 1 = yes, 0 = no).
The results of the regression analysis are given below:
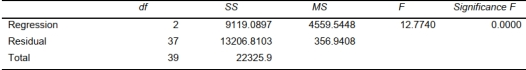
-Referring to Scenario 14-17, which of the following is the correct null hypothesis to determine whether there is a significant relationship between the number of weeks a worker is unemployed
Due to a layoff and the entire set of explanatory variables? a)
b)
c)
d)
Definitions:
Complex Visuals
Intricate graphics or images that communicate detailed information or concepts.
Data Displays
The presentation of data in a visual format, like charts or graphs, to make information easier to understand and analyze.
Edited Photographs
Photographs that have been altered or changed from their original state, often through digital means, to enhance or adjust their appearance.
Pie Chart
A circular chart whose sections represent percentages of a given quantity.
Q33: Referring to Scenario 15-7-B, the model
Q72: Referring to Scenario 15-6, what is the
Q90: Referring to Scenario 13-5, the partner wants
Q111: Referring to Scenario 13-12, what are the
Q129: Referring to Scenario 12-5, the value of
Q132: Referring to Scenario 14-16, what is
Q144: Referring to Scenario 14-1, for these data,
Q161: Referring to Scenario 12-13, the value of
Q175: Referring to Scenario 13-12, there is a
Q335: Referring to Scenario 14-18, there is not