SCENARIO 14-17
Given below are results from the regression analysis where the dependent variable is the number of
weeks a worker is unemployed due to a layoff (Unemploy) and the independent variables are the age
of the worker (Age) and a dummy variable for management position (Manager: 1 = yes, 0 = no).
The results of the regression analysis are given below:
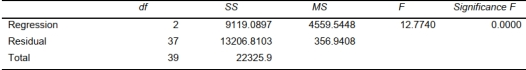
-Referring to Scenario 14-17, the null hypothesis implies that the number of
weeks a worker is unemployed due to a layoff is not affected by any of the explanatory variables.
Definitions:
Market Value
The current price at which an asset or service can be bought or sold in a market, reflecting its perceived value by participants.
Balance Sheet
A financial report that presents the assets, liabilities, and shareholders' equity of a company at a specific time.
Outstanding Shares
The total number of shares of stock that have been issued and are currently held by investors, including public shareholders and company insiders.
Cash Dividends
Payments made by a corporation to its shareholders from profits in the form of cash.
Q29: Referring to Scenario 13-10, the value of
Q32: Referring to Scenario 12-13, the critical value
Q61: Referring to Scenario 13-7, to test
Q77: Referring to Scenario 15-5, what is the
Q88: The value of r is always positive.
Q94: The width of the prediction interval for
Q103: Referring to Scenario 13-10, it is inappropriate
Q195: Referring to Scenario 14-10, the proportion of
Q221: The Y-intercept (b0) represents the<br>A) estimated average
Q250: Referring to Scenario 14-15, estimate the mean