SCENARIO 14-20-B
You are the CEO of a dairy company. You are planning to expand milk production by purchasing
additional cows, lands and hiring more workers. From the existing 50 farms owned by the company,
you have collected data on total milk production (in liters) , the number of milking cows, land size (in
acres) and the number of laborers. The data are shown below and also available in the Excel file
Scenario14-20-DataB.XLSX.
MILK 84686 101876 103248 70508 76072 86615 87508 105195 120351 68658 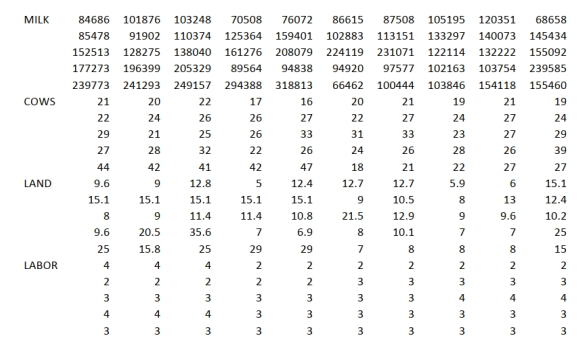
You believe that the number of milking cows , land size and the number of laborers are the best predictors for total milk production on any given farm.
-Referring to Scenario 14-20-B, which of the following is a correct interpretation for the adjusted r-square?
Definitions:
Work Responsibility
Involves the duties and tasks that an individual is expected to perform as part of their job role.
Final Job Assignment
The last task or project assigned to an employee within their current role or before a transition, such as promotion or departure from the company.
Dead-End Job
A job with little to no prospect for career growth or advancement.
Qualified Workforce
Personnel that possess the necessary skills, education, and experience required to perform the tasks of their respective jobs effectively.
Q11: Referring to Scenario 14-8, the estimated change
Q58: Referring to Scenario 15-7-B, the variable X2
Q60: Referring to Scenario 14-5, when the microeconomist
Q61: Referring to Scenario 11-2, the p-value of
Q95: Referring to Scenario 13-2, what is the
Q101: Referring to Scenario 14-5, what is the
Q174: Referring to Scenario 12-11, the same decision
Q281: Referring to Scenario 14-15, what are the
Q292: Referring to Scenario 14-17, which of
Q368: Referring to Scenario 14-11, what is the