SCENARIO 14-20-B
You are the CEO of a dairy company. You are planning to expand milk production by purchasing
additional cows, lands and hiring more workers. From the existing 50 farms owned by the company,
you have collected data on total milk production (in liters), the number of milking cows, land size (in
acres) and the number of laborers. The data are shown below and also available in the Excel file
Scenario14-20-DataB.XLSX.
MILK 84686 101876 103248 70508 76072 86615 87508 105195 120351 68658 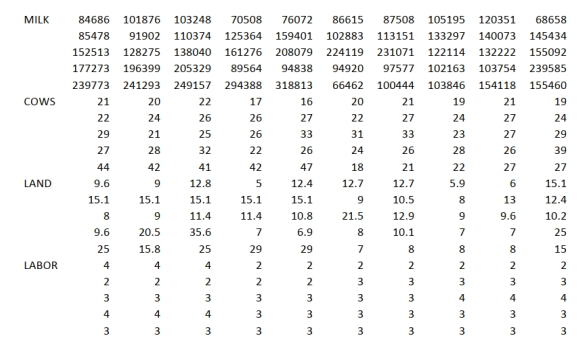
You believe that the number of milking cows , land size and the number of laborers are the best predictors for total milk production on any given farm.
-Referring to Scenario 14-20-B, construct the normal probability plot for the regression
residuals.
Definitions:
Availability
The extent to which a product or service is obtainable and ready for use by customers.
Cost of Labor
The total amount spent by businesses on employee wages, benefits, and payroll taxes.
Supply Chain Operation
The execution and management of activities involved in sourcing, procurement, conversion, and logistics management to produce and deliver goods or services.
Logistics Facility Location
The strategic decision-making process regarding the placement of logistical facilities, such as warehouses and distribution centers, to optimize supply chain efficiency.
Q1: Referring to Scenario 14-6, what is the
Q28: Referring to Scenario 12-13, if there is
Q30: Referring to Scenario 13-4, the coefficient of
Q43: Referring to Scenario 13-10, what is the
Q51: Referring to Scenario 15-6, what is the
Q53: Referring to Scenario 15-6, the model that
Q85: Referring to Scenario 13-13, the p-value of
Q178: Referring to Scenario 12-16, the calculated value
Q207: Referring to Scenario 13-3, the coefficient of
Q226: Referring to Scenario 13-7, to test whether