SCENARIO 14-16
What are the factors that determine the acceleration time (in sec.) from 0 to 60 miles per hour of a
car? Data on the following variables for 30 different vehicle models were collected: (Accel Time): Acceleration time in sec.
(Engine Size): c.c.
(Sedan): 1 if the vehicle model is a sedan and 0 otherwise
The regression results using acceleration time as the dependent variable and the remaining variables as the independent variables are presented below.
ANOVA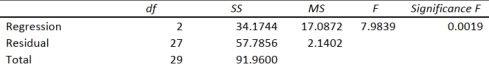
-Referring to Scenario 14-16, the 0 to 60 miles per hour acceleration time of a
sedan is predicted to be 0.7264 seconds higher than that of a non-sedan with the same engine size.
Definitions:
Advantages
The conditions or factors that put someone or something in a favorable or superior position compared to others.
Disadvantages
Refers to the negative aspects, drawbacks, or cons that are associated with a decision, situation, or policy.
Delayering
Reducing the number of levels in the organization's job structure.
Organization's Flexibility
The ability of an organization to adapt to changes, innovate, and adjust its operations or structure in response to external or internal stimuli.
Q50: Referring to Scenario 15-5, there is reason
Q59: Referring to Scenario 13-14-A, the decision on
Q75: Referring to Scenario 15-7-A, what is your
Q96: Referring to Scenario 12-1, what is
Q109: Referring to Scenario 13-14-A, construct a scatter
Q144: Referring to Scenario 15-1, what is the
Q168: Referring to Scenario 13-14-A, the p-value of
Q211: Referring to Scenario 13-5, the estimates of
Q268: Referring to Scenario 14-14, the predicted mileage
Q298: Referring to Scenario 14-8, _% of the