SCENARIO 14-16
What are the factors that determine the acceleration time (in sec.) from 0 to 60 miles per hour of a
car? Data on the following variables for 30 different vehicle models were collected: (Accel Time): Acceleration time in sec.
(Engine Size): c.c.
(Sedan): 1 if the vehicle model is a sedan and 0 otherwise
The regression results using acceleration time as the dependent variable and the remaining variables as the independent variables are presented below.
ANOVA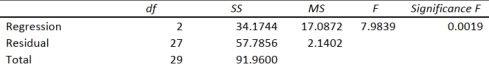
-Referring to Scenario 14-16, the 0 to 60 miles per hour acceleration time of a
sedan is predicted to be 0.7264 seconds lower than that of a non-sedan with the same engine size.
Definitions:
Cultural-Transmission
The process by which culture, including knowledge, customs, and values, is passed down from one generation to the next.
Deviance
Behaviors or actions that violate societal norms or expectations, which can range from minor to serious offenses, eliciting social reactions.
Strain
Refers to breakdowns in traditional norms that precede collective action.
Q24: Referring to Scenario 13-10, generate the scatter
Q63: Using the best-subsets approach to model
Q66: Referring to Scenario 14-17, the alternative
Q72: Referring to Scenario 14-17, the null
Q88: When using the <span class="ql-formula"
Q107: Referring to Scenario 12-7, there is sufficient
Q126: A multiple regression is called "multiple" because
Q151: Referring to Scenario 14-18, what is the
Q160: Referring to Scenario 12-4, the degrees of
Q238: The Chancellor of a university has commissioned