SCENARIO 14-16
What are the factors that determine the acceleration time (in sec.) from 0 to 60 miles per hour of a
car? Data on the following variables for 30 different vehicle models were collected: (Accel Time): Acceleration time in sec.
(Engine Size): c.c.
(Sedan): 1 if the vehicle model is a sedan and 0 otherwise
The regression results using acceleration time as the dependent variable and the remaining variables as the independent variables are presented below.
ANOVA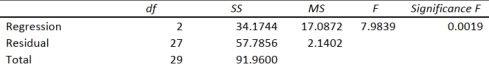
-Referring to Scenario 14-16, there is enough evidence to conclude that being a
sedan or not makes a significant contribution to the regression model in the presence of the other
independent variable at a 5% level of significance.
Definitions:
Educational Achievement
Is the learning of valuable skills and knowledge.
Honours Designation
A recognition awarded to students who achieve high academic performance during their university or college education.
Biology Class
An educational course focusing on the study of living organisms, their structure, function, growth, evolution, and distribution.
Literacy
The ability to read and write at a level that enables communication, understanding, and participation in society.
Q44: Referring to Scenario 14-17, what is the
Q52: Referring to Scenario 15-7-B, the value of
Q74: Referring to Scenario 15-7-A, the p value
Q109: Referring to Scenario 15-5, what is the
Q122: A multiple regression is called "multiple" because
Q154: Referring to Scenario 12-10, what is the
Q162: Referring to Scenario 14-13, the effect of
Q196: Referring to Scenario 13-2, what is
Q222: Referring to Scenario 14-19, there is not
Q339: Referring to Scenario 14-7, the predicted GPA