SCENARIO 14-16
What are the factors that determine the acceleration time (in sec.) from 0 to 60 miles per hour of a
car? Data on the following variables for 30 different vehicle models were collected: (Accel Time): Acceleration time in sec.
(Engine Size): c.c.
(Sedan): 1 if the vehicle model is a sedan and 0 otherwise
The regression results using acceleration time as the dependent variable and the remaining variables as the independent variables are presented below.
ANOVA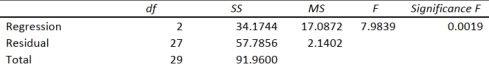
-Referring to Scenario 14-16, ________ of the variation in Accel Time can be explained by
engine size while controlling for the other independent variable.
Definitions:
Notebook Computers
Portable computers designed for mobile use, smaller and lighter than desktop models but having similar capabilities.
Midrange Systems
Computers that possess greater data processing power than personal computers but are less powerful than large mainframe systems.
Processing Speeds
Refers to the rate at which a computer or human can complete a task or process information.
Enterprise Resource Planning System
Integrated software platforms used by organizations to manage and automate many back office functions related to services, technology, and human resources.
Q6: Referring to Scenario 15-4, the "best"
Q23: Referring to Scenario 12-9, at 5% level
Q33: Referring to Scenario 13-4, the prediction for
Q38: Collinearity is present when there is a
Q75: Referring to Scenario 13-1, interpret the estimate
Q110: Referring to Scenario 15-7-B, the model
Q146: Which of the following will NOT change
Q257: Referring to Scenario 14-5, the observed value
Q258: Referring to Scenario 14-19, what is the
Q293: Referring to Scenario 14-19, which of the